 vivibeBeta
See what your frontend did: every render, every API call
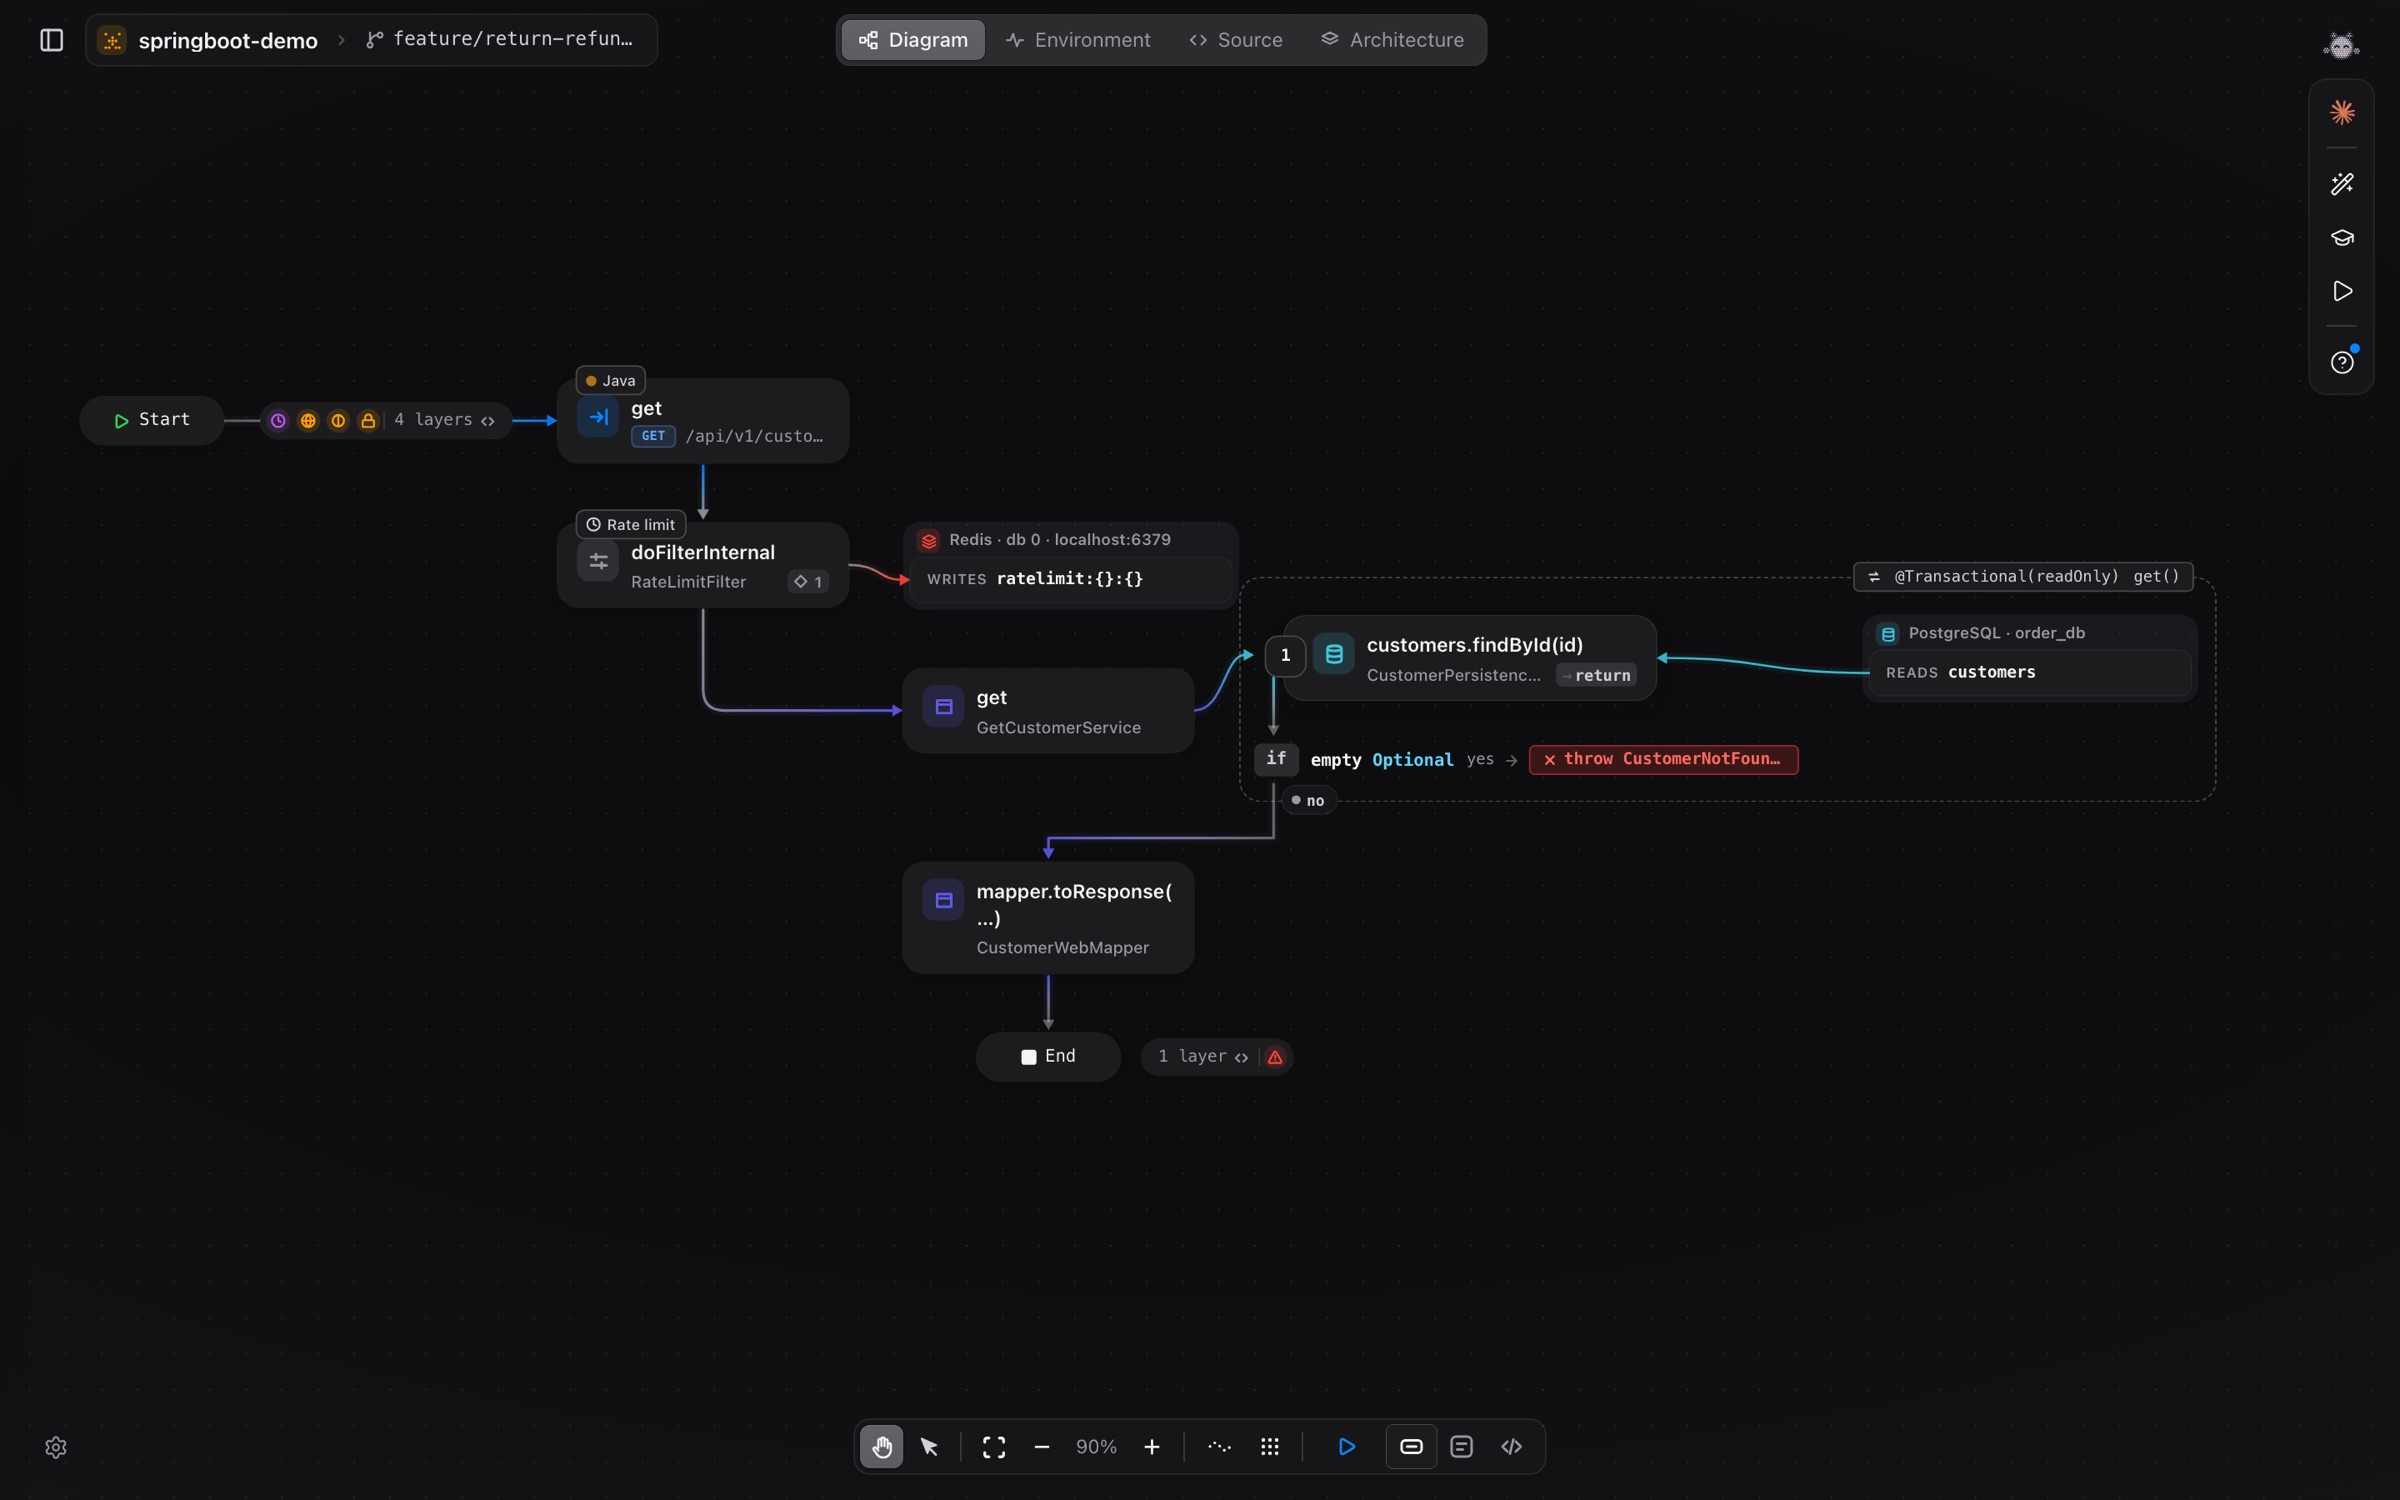
Run your app in vivibe and the diagram marks which blocks ran, says why each one rendered and how many times, and lists every API call with the component that made it.
Run app plays your frontend beside its diagram: you click in the app, and the blocks that ran light up. From 0.1.29 the diagram also tells you why each block ran, how often, and what it asked the server for.
Exactly which blocks ran
- Blocks that use the same component each show their own run. A list drawn nine times shows nine runs, not one.
- Large pages are no longer cut short.
- A block that did not run shows the condition that skipped it.
Why it rendered
The card beside a block says in plain words why it rendered: its state changed, its parent re-rendered, or query data arrived. It shows the state a component starts with and the DOM it creates when it first appears, and it groups repeated lines with a count.
Each block also counts how many times it rendered and how many API calls it made, so wasted renders stand out.
An API tab
A new API tab lists every request with its status, its duration and a timeline.
- The same endpoint called twice in one action is flagged.
- Each request names the component that made it.
- Click a row to highlight that component in the app and on the diagram.
And when you click a link to another screen, the diagram moves to that screen’s flow.
Also in 0.1.29
- Code screen: connect GitLab, Azure DevOps, AWS CodeCommit and Google Secure Source Manager.
- Diffs follow GitHub’s styling, the Git panel uses native macOS controls, and images, binary files and large text files open in the viewer.
- Flow diagram: the framework-layer strip folds away,
ifblocks line up, and a switch sets how much detail the cards show. - Environment: when an app is meant to run from your IDE, Start becomes Open in IDE.
- Fixed: reporting an error could freeze the app on very large screens.